作文题1 图表
关键词:占比 上升趋势 更多的
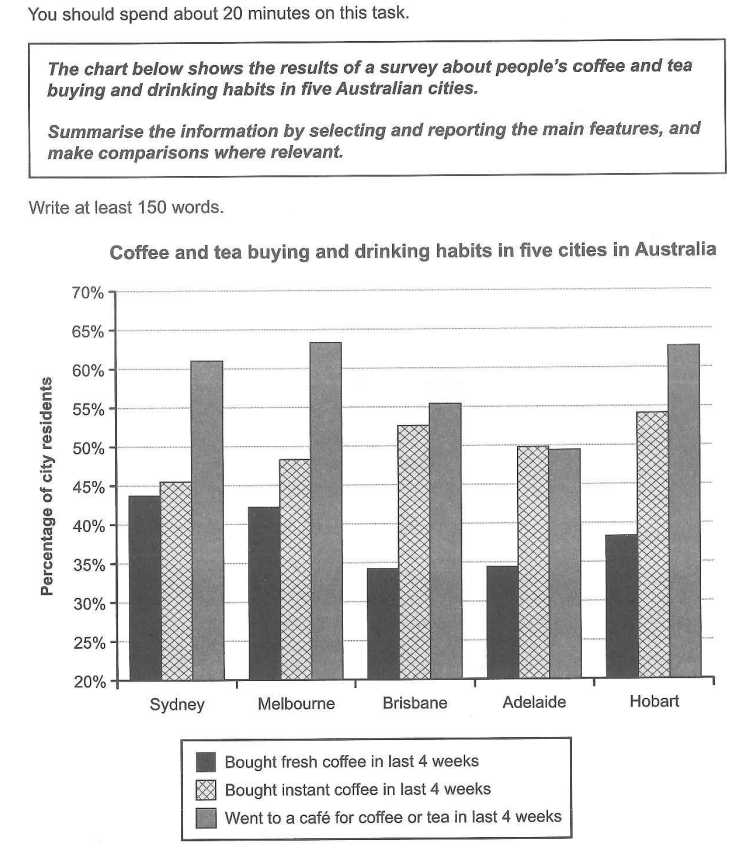
The line graph above shows the habits of people buying and drinking coffee and tea in five cities in Australia.
According to the chart,people in Melbourne have the most interest in coffe and tea,with about 63% of them have gone to a cafe in the past four weeks.There’s only a samll margin between Hobart and Melbone,as almost 63% of peple in Hobart went to a cafe. There’s only a small margin between Hobart and Melbone,as almost 63% of people have the habit.
In the five cities of Australia,people prefer instant coffee rather than fresh coffee.People who bought instant coffee in the past four weeks make up over half of people went to a cafe on Hobart,but only 35 percentage of them bought fresh coffee.The least of them are people in Brishane,where only a proportion of 50% people went to a cafe.
作文题2 议论

关键词:拥有 大量的(单/复数) 非常好的
思考:
In recent years, there have been more and more people in some countries who prefer purchasing a home on their own rather than renting one.
There may be many reasons accounting for this phenomenon. Firstly, in many countries, the ownership of a house is related to whether the kids of the household can go to school and receive a fabulous education. Secondly, owning a home means that people have no concerns about being asked to move out of the house by the renter at any time, which offers a strong sense of safety and stability for people, Aside from these factors, people who buy a house can decorate their rooms and choose a renovation arbitrarily regardless of how strange they are. I used to rent a house with strangers when I was an intern, it bothered me so much that I had to tolerate the noise they made and share the private space with them. That is the reason why I also prefer to have a house on my own.
From my humble perspective, it will have more advantages if people would rather purchase their new house. Instead of renting a house for several periods(不许加of time 重复), owning a house will cost a large amount of fortune in many countries, which not only cultivates a tendency for young people to save their money and regulate their unreasonable desires but also has a positive effect on governments’ revenue of selling areas to the enterprises who sell the houses.
To summarize, I think people’s rising need for owning a house can indirectly improve the prosperity of the country.
得分:6.5
The chart and the form below illustrate the causes attributing to land degradation in the dimension of worldwide field and regions including North America,Europe and Oceania.
The pie chart clearly shows three main reasons for land degradation.Among all of them,over-grazing occupies the biggest proportion of 35%.Following is deforestation,which accounts for 30% of land-degration. Over-cultivation is also an important cause, only 2% lower than deforestation at 28%.Aside from the three main causes,there also remains 7% of other reasons making up for the land degradation.
The form below concretely shows the statistics of the causes responsible for the land degradation by region.Eroupe,which has the highest total land degraded percentage,is mostly influenceded by deforestation at 9.8%. Even the lowest proportion ——over-grazing is up to 5.5%.Oceania’s land degraded situation is the best among the three continents at 13% only. In contrast to Europe,over-grazing is the leading reason with the highest proportion of 11.3% in Oceania.The lowest of that is over-cultication at 0%.In North America,the lands are least degraded comparing to Europe and Oceania,with the highest figure of over-cultivation at 3.3%.
In conclusion,over-grazing is the most common cause of land-degration all over the world.
修改稿:
The pie chart and table below illustrate the causes contributing to land degradation worldwide and in specific regions, including North America, Europe, and Oceania.
The pie chart clearly shows three main reasons for land degradation. Among all of them, over-grazing occupies the largest proportion at 35%. Following this is deforestation, which accounts for 30% of land degradation. Over-cultivation is also a significant cause, only 2% lower than deforestation at 28%. Besides these three main causes, there remains 7% attributed to other reasons.
The table concretely shows the statistics of the causes responsible for land degradation by region. Europe, which has the highest total land degraded percentage, is mostly affected by deforestation at 9.8%. Even the lowest proportion, over-grazing, is up to 5.5%. Oceania’s land degradation situation is better among the three regions at 13%. In contrast to Europe, over-grazing is the leading cause with the highest proportion of 11.3% in Oceania. The lowest is over-cultivation at 0%. In North America, the lands are least degraded compared to Europe and Oceania, with the highest figure being over-cultivation at 3.3%.
In conclusion, over-grazing is the most common cause of land degradation worldwide.
范文
The pie chart and table illustrate the primary causes of agricultural land degradation globally and in three regions: North America, Europe, and Oceania.
The pie chart reveals that over-grazing is the leading cause of worldwide land degradation, accounting for 35% of the total. Deforestation follows closely at 30%, while over-cultivation contributes 28%. Other causes make up the remaining 7%.
The table provides a regional breakdown of land degradation causes during the 1990s. Europe experienced the highest total land degradation at 23%, with deforestation being the primary contributor at 9.8%. Over-cultivation and over-grazing also significantly affected Europe, with percentages of 7.7% and 5.5%, respectively.
In Oceania, 13% of the land was degraded, with over-grazing being the predominant cause at 11.3%. Deforestation contributed 1.7%, while over-cultivation had no impact.
North America had the lowest total land degradation at 5%. Over-cultivation was the major cause at 3.3%, followed by over-grazing at 1.5% and deforestation at 0.2%.
In summary, over-grazing is the most prevalent cause of land degradation globally, with each region having specific primary causes contributing to their land degradation levels.
This version is more concise and polished, ensuring better clarity and readability. It also makes use of varied sentence structures and vocabulary to enhance the overall quality of the response.